Maths WBBSE Class 10 Solutions Chapter 26 Statistics Mean, Median, O Give, Mode Exercise 26.3
Question 1. The following distribution table shows the daily profit (in Rs.) of 100 shops in our village.

“WBBSE Class 10 Maths Statistics Mean, Median, Mode Exercise 26.3 solutions”
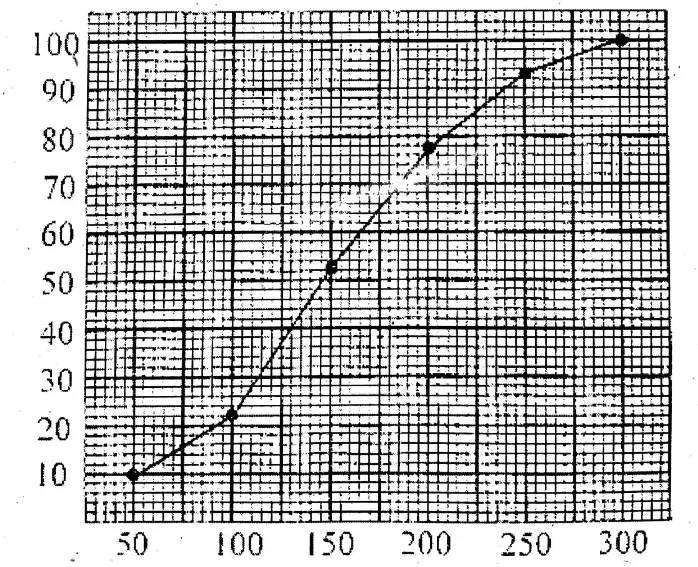
Making a cumulative frequency table (less than type) of the given frequency table, let us draw Ogive on graph paper.
Solution:
Read and Learn More WBBSE Solutions For Class 10 Maths

Assuming on graph paper along the x-axis 1 small division= 1 unit & along the y-axis 1 small division = 1 unit, & plot the points (50, 10), (100, 26), (150, 54), (200, 76), (250, 94) & (300, 100); by joining the points, we get the Ogive less than type.
Question 2. The following data shows the weight of 35 students in the class of Nivedita.

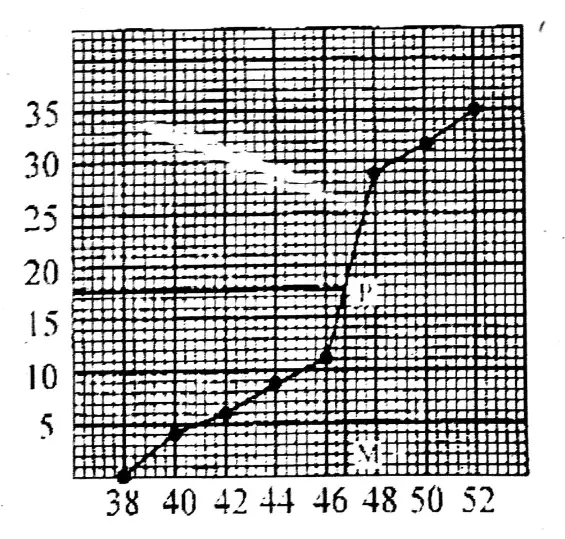
Making cumulative frequency (less than type) distribution table, let us draw Ogive on graph paper and hence let us find the median from the graph. Let us find the median by using a formula and verify it.
Solution:

Here, n = 35
∴ \(\frac{n}{2}\) = \(\frac{35}{2}\) = 17.5
At the y-axis, find the point (0, 17.5)
Now plotting the points we draw the graph.
Perpendicular from the point (0, 17.5) cuts the graph at P.
Draw the perpendicular from P on the x-axis (P.M)
∴ M is the median.
The median class is (46-48).
∴ Median = \(\ell+\left[\frac{\frac{n}{2}-\mathrm{c} . f}{f}\right] \times h=46+\left(\frac{17.5-12}{16}\right) \times 2=46+\frac{5.5}{8}=46+0.69\)
Median = 46.69
“West Bengal Board Class 10 Maths Chapter 26 Statistics Mean, Median, Mode Exercise 26.3 solutions”
Question 3.

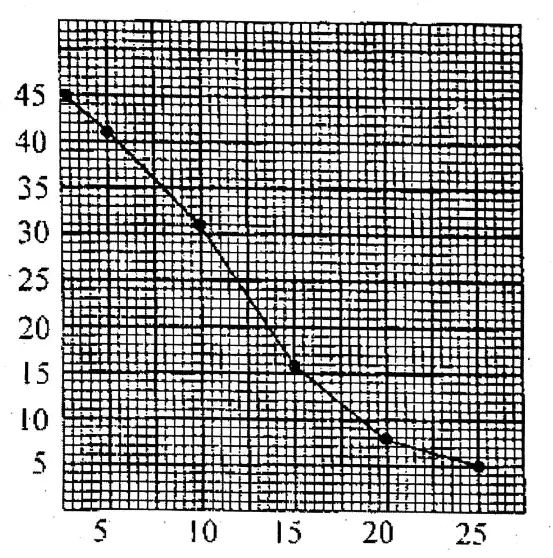
Making cumulative frequency (greater than type) distribution table of given data, let us draw Ogive on graph paper.
Solution:
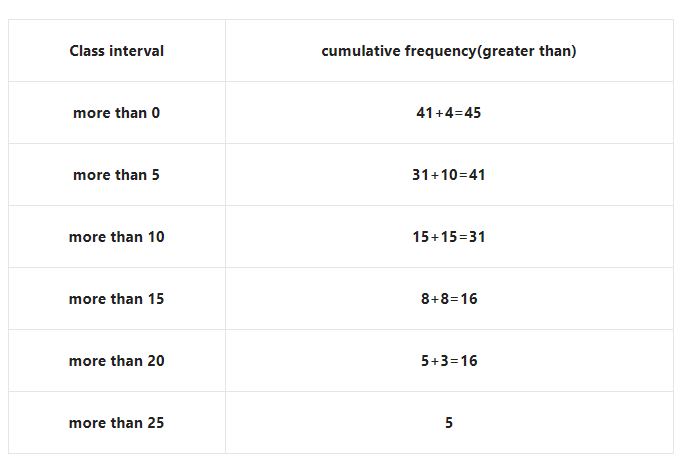
Plot the points (0, 45), (5, 41), (10, 31), (15, 16), (20, 8) & (25, 5), by joining then we got the Ogive.
Question 4.

“WBBSE Class 10 Statistics Mean, Median, Mode Exercise 26.3 solutions explained”
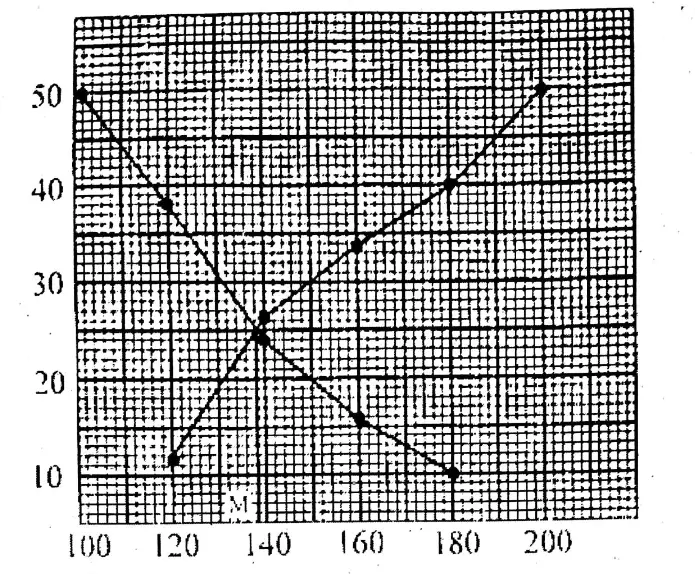
Drawing less than Ogive and greater than type Ogive of given data along the same axes, on the graph paper, let us find the median from the graph.
Solution:

For less than type Ogive, plot the points (120, 12), (140, 26), (160, 34), (180, 40) & (200, 50), by joining them we get the Ogive (less than type).
For greater than type Ogive, plot the points (100, 50), (120, 38), (140, 24), (160, 16) & (180, 10), by joining them we get Ogive (greater than type)
The median from the graph = 139 (Approx.)
Application 1. Let us find the mode of the data given below.
1. 2, 3, 5, 6, 2, 4, 2, 8, 9, 4, 5, 4, 7, 4, 4
2. 11, 27, 18, 26, 13, 12, 9, 15, 4, 9
3. 102, 104, 117, 102, 118, 104, 120, 104, 122, 102
4. 5, 9, 18, 27, 15, 5, 8, 10, 16, 5, 7, 5
Solution: Let us write the number of given data in ascending order of magnitude
1. 2, 3, 5, 6, 2, 4, 2, 8, 9, 4, 5, 4, 7, 4, 4
We see 4 occur a maximum number of times
The mode = 4
2. Let us write the number of given data in ascending order of magnitude. 4, 9, 9, 11, 12, 13, 15, 18, 26, 27
We see 9 occurs a maximum number of times.
∴The mode = 9
3. Write the number of given data in ascending order 102, 102, 102, 104, 104, 104, 117, 118, 120, 122.
Here 102 & 104 occur a maximum number of times.
∴The mode = 102 & 104
4. Write the number of given data in ascending order.
5, 5, 5, 5, 7, 8, 9, 10, 15, 16, 18, 27
Here 5 occurs a maximum number of times.
∴ The mode = 5
Application 2. The mode of frequency distribution table is given below.

Solution:

“WBBSE Class 10 Maths Exercise 26.3 Statistics Mean, Median, Mode problem solutions”
Maximum frequency 24
∴ Modal class = 12 – 15
Here l = 12, f1 = 24, f0 = 12, f2 = 21, h = 15 – 12 = 3
∴ Mode = \(\ell+\left[\frac{f_1-f_0}{2 f_1-f_0-f_2}\right] \times h\)
= \(12+\left[\frac{24-12}{2 \times 24-12-21}\right] \times 3\)
= \(12+\frac{12}{48-33} \times 3\)
= \(12+\frac{12}{15} \times 3\)
Mode= 12 + 2.4 = 14.4
