
Class IX Maths Solutions WBBSE Chapter 11 Statistics Exercise 11.1
Question 1. I have written the number of children belonging to each of 40 families in our locality below
| 1 | 2 | 6 | 5 | 1 | 5 | 1 | 3 | 2 | 6 |
| 2 | 3 | 4 | 2 | 0 | 4 | 4 | 3 | 2 | 2 |
| 0 | 0 | 1 | 2 | 2 | 4 | 3 | 2 | 1 | 0 |
| 5 | 1 | 2 | 4 | 3 | 4 | 1 | 6 | 2 | 2 |
I prepare a frequency distribution table of the above-given data whose classes are 0-2, 2-4,…….., etc.
Solution: Frequency distribution table
| Class Interval | Class Size | Length of Class | Tally Mark | Frequency |
| 0-2 | 0-2 | 2 | 11 | |
| 2-4 | 2-4 | 2 | 17 | |
| 4-6 | 4-6 | 2 | 9 | |
| 6-8 | 8-Jun | 2 | III | 3 |
| Total | 40 |
Read and Learn More WBBSE Solutions For Class 9 Maths
Question 2. Given below are the marks obtained by 40 students in a test of school:
| 34 | 27 | 45 | 21 | 30 | 40 | 11 | 47 | 1 | 15 |
| 3 | 40 | 12 | 47 | 48 | 18 | 30 | 24 | 25 | 28 |
| 32 | 31 | 25 | 22 | 27 | 41 | 12 | 13 | 2 | 44 |
| 43 | 7 | 9 | 49 | 13 | 19 | 32 | 39 | 24 | 3 |
I construct a frequency distribution table of these marks by taking classes 1-10, 11-20, ………, 41-50.
Solution: Frequency distribution table
| Class | Tally mark | Frequency |
| 1-10 | 6 | |
| 11-20 | 8 | |
| 21-30 | 11 | |
| 31-40 | 7 | |
| 41-50 | 8 | |
| Total | 40 |
Wbbse Class 9 Maths Chapter 11 Statistics Solutions
Question 3. There are many oranges in a basket. From this basket, by aimlessly taking 40 oranges, I wrote below their weights (gm):
45, 35, 30, 55, 70, 100, 80, 110, 80, 75, 85, 70, 75, 85, 90, 75, 90, 30, 55, 45, 40, 65, 60, 50, 40, 100, 65, 60, 40, 100, 75, 110, 30, 45, 84, 70, 80, 95, 85, 70.
Now, I construct a frequency distribution table and a less-than-type cumulative frequency distribution table for the above-given data.
Solution: Maximum weight = 110 gm
Minimum weight = 30 gm
∴ Width = 110-30=80 gm
Size of class = 10
| Class | Tally mark | Frequency | Cumulative Frequency |
| 30-40 | llll | 4 | 4 |
| 40-50 | 6 | 4 + 6=10 | |
| 50-60 | III | 3 | 10 + 3=13 |
| 60-70 | llll | 4 | 13 + 4=17 |
| 70-80 | 8 | 17 + 8 = 25 | |
| 80-90 | 7 | 25 + 7 = 32 | |
| 90-100 | III | 3 | 32 + 3 = 35 |
| 100-120 | III | 3 | 35 + 3 = 38 |
| 110-120 | II | 2 | 38 + 2 = 40 |
| Total | 40 |
Note: If the same value occurs in two classes put the value in a higher class.

Wbbse Class 9 Statistics Chapter Exercise Solutions
Question 4. Mitali and Mohidul wrote below the amount of money of electricity bills of the 45 houses of their village for this month:
116, 127, 100, 82, 80, 101, 91, 65, 95, 89, 75, 92, 129, 78, 87, 101, 65, 52, 59, 65, 95, 108, 115, 121, 128, 63, 76, 130, 116, 108, 118, 61, 129, 127, 91, 130, 125, 101, 116, 105, 92, 75, 98, 65, 110.
I construct a frequency distribution table for the above data.
Solution:
Given
116, 127, 100, 82, 80, 101, 91, 65, 95, 89, 75, 92, 129, 78, 87, 101, 65, 52, 59, 65, 95, 108, 115, 121, 128, 63, 76, 130, 116, 108, 118, 61, 129, 127, 91, 130, 125, 101, 116, 105, 92, 75, 98, 65, 110.
Frequency distribution table
| Class | Tally Mark | Frequency |
| 50-60 | II | 2 |
| 60-70 | 6 | |
| 70-80 | llll | 4 |
| 80-90 | llll | 4 |
| 90-100 | 7 | |
| 100-110 | 7 | |
| 110-120 | 6 | |
| 120-130 | 7 | |
| 130-140 | II | 2 |
| Total frequency | 45 |
Question 5. Maria has written the ages of 300 patients of a hospital in the table given below:
| Ages (years) | 10-20 | 20-30 | 30-40 | 40-50 | 50-60 | 60-70 |
| The number of patients | 80 | 40 | 50 | 70 | 40 | 20 |
I construct a more than type cumulative frequency distribution table for the above data.
Solution: More than type cumulative frequency distribution label
| Age (years) Class | No. of patients Frequency | Cumulative frequency |
| 10-20 | 80 | 220 + 80 = 300 |
| 20-30 | 40 | 180 + 40 = 220 |
| 30-40 | 50 | 130 + 50 = 180 |
| 40-50 | 70 | 60 + 70 = 130 |
| 50-60 | 40 | 20 + 40 = 60 |
| 60-70 | 20 | 20 |
| Total | 300 |
Question 6. Let us observe the following cumulative frequency distribution table and construct a frequency distribution table:
| Classes | Below 10 | Below 20 | Below 30 | Below 40 | Below 50 | Below 60 |
| The number of students | 17 | 22 | 29 | 37 | 50 | 60 |
Class 9 Wbbse Maths Statistics Solved Problems
Solution: Frequency distribution table
| Class no. of students | Frequency | Cumulative frequency |
| 10 | 17 | 17 |
| 10-20 | 22-17 = 5 | 22 |
| 20-30 | 29-22 = 7 | 29 |
| 30-40 | 37-29 =8 | 37 |
| 40-50 | 50-37 = 13 | 50 |
| 50-60 | 60-50 = 10 | 60 |
Question 7. Let us observe the following cumulative frequency distribution table and construct the frequency distribution table :
| Marks obtained | The number of students |
| More than 60 | 0 |
| More than 50 | 16 |
| More than 40 | 40 |
| More than 30 | 75 |
| More than 20 | 87 |
| More than 10 | 92 |
| More than 0 | 100 |
Class IX Maths Solutions WBBSE
Solution: Frequency distribution table
| Marks | Class | The no. of students | Frequency |
| More than 60 | More than 60 | 0 | 0 |
| More than 50 | 50-60 | 16 | 16-0 = 16 |
| More than 40 | 40-50 | 40 | 40-16 = 24 |
| More than 30 | 30-40 | 75 | 75-40 = 35 |
| More than 20 | 20-30 | 87 | 87-75 = 12 |
| More than 10 | 10-20 | 92 | 92-87 = 5 |
| More than 0 | 0-10 | 100 | 100-92 = 8 |
Question 8.
1. Which one of the following is a graphical (pictorial) representation of statistical data?
1. Line graph
2. Raw data
3. Cumulative frequency
4. Frequency.
Solution: 1. Line graph
Wbbse Class 9 Maths Chapter 11 Statistics Notes
2. The range of the data 12, 25, 15, 18, 17, 20, 22, 26, 6, 16, 11, 8, 19, 10, 30, 20, 32 is
1. 10
2. 15
3. 18
4. 26
Solution: Greatest value = 32
Minimum value = 6
Range 326 = 26
∴ 4. 26
3. The class size of classes 1-5, 6-10 is
1. 4
2. 5
3. 4.5
4. 5.5
Solution: Class size=5-110-6=4
∴ 1. 4
Class 9 Maths WB Board
4. In a frequency distribution table, the mid-points of the classes are 15, 20, 25, 30 ……. respectively. The class having a mid-point as 20 is
1. 12.5-17.5
2. 17.5-22.5
3. 18.5 21.5
4. 19.5 20.5
Solution: 20-15-25-20-30-25=5
∴ Class size = 5
Class size of 1st class = 17.5-12.5 = 5
Mid value = \(\frac{12.5+17.5}{2}=\frac{30.0}{2}=15 \neq 20\)
In the class, 17.5-22.5, class size = 22.5 17.5 = 5
Mid value = \(\frac{12.5+17.5}{2}\) = 20
The mid value of the last two classes is 20, but the class length is not 5.
∴ 2. 17.5 22.5
5. In a frequency distribution table if the mid-point of a class is 10 and the class size of each class is 6; the lower limit of the class is
1. 6
2. 7
3. 8
4. 12
Solution: Let upper limit of = x and lower limit = y.
According to the problem, 1st conditions: \(\frac{x+y}{2}=10\)
or, x + y = 20 …..(1)
According to the problem, 2nd conditions:
or, x – y = 6 ….(2)
Subtracting (2) from (1), 2y = 14
or, \(y=\frac{14}{2}=7\)
∴ Lower limit of the class
∴ 2. 7
West Bengal Board Class 9 Statistics Chapter Solutions
Question 9.
1. In a continuous frequency distribution table if the mid-point of a class is m and the upper-class boundary is u, then let us find out the lower-class- boundary.
Solution: Mid value of the class = m
Upper boundary of the class = u
∴ Mid value = m
∴ Lower class boundary= 2 x mid value =2 x m-u = 2m – u
2. In a continuous frequency distribution table, if the mid-point of a class is 42 and class size is 10, then let us write the upper and lower limits of the class.
Solution: Let the upper-class boundary be x and the lower boundary be y. According to the problem, 1st condition
According to the problem, 1st condition \(\frac{x+y}{2}=42\)
or, x + y = 84 ……(1)
According to the problem, 2nd condition 2x = 94
or, \(x=\frac{94}{2}=47\)
Putting the value of x in equation (1), 47 + y = 84
⇒ y= 84-47 = 37
∴ Upper limit = 47
Lower limit 37
Class 9 Maths WBBSE
3. Let us write the frequency density of the first class of the frequency distribution table.
| Class- limit | 70-74 | 75-79 | 80-84 | 85-89 |
| Frequency | 3 | 4 | 5 | 8 |
Solution: 1st class = 70-74
Class size the 1st class = 74-70 = 4
Frequency of the 1st class = 3
Frequency dencing of the 1st class \(=\frac{\text { Frequency }}{\text { Classsize }}\)
\(=\frac{3}{4}\)= 0.75
4. Let us write the frequency density of the last class
| Class- limit | 70-74 | 75-79 | 80-84 | 85-89 |
| Frequency | 3 | 4 | 5 | 8 |
Solution: Last class = 85-89
Frequency = 8
Total frequency=3+4+5+8=20
∴ Frequency of the class \(y=\frac{\text { Frequency of the class }}{\text { Total frequency }}\)
\(\begin{aligned}& =\frac{8}{20} \\
& =\frac{2}{5}=0.4
\end{aligned}\)
5. Let us write from the following examples which one indicates attribute and which one indicates variable.
1. Population of the family.
2. Daily temperature.
3. Educational value.
4. Monthly income.
5. Grade obtained in Madhyamik Examination.
Solution:
1. Population of the family – Variable
2. Daily temperature – Variable
3. Educational – Attribute
4. Monthly income – Variable
5. Grade obtained in – Attribute
Class 9 Maths WBBSE Chapter 11 Statistics Exercise 11.2
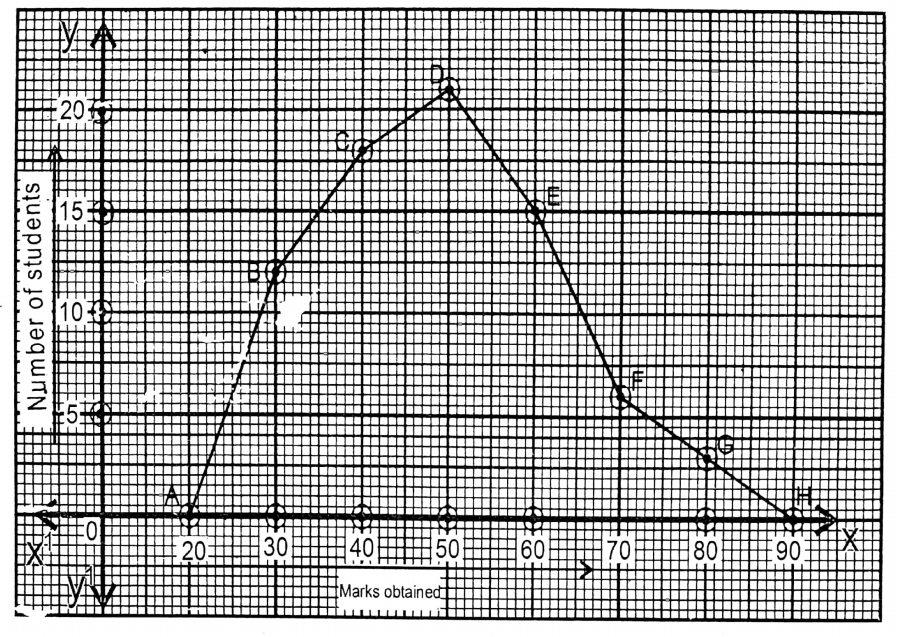
Question 1. I construct the frequency polygon for the following marks obtained by 75 learners of Pritha’s school:
| Marks obtained | 30 | 40 | 50 | 60 | 70 | 80 |
| Number of students | 12 | 18 | 21 | 15 | 6 | 3 |
Wbbse Class 9 Statistics Chapter Important Questions
In the graph paper, taking suitable measures along horizontal and vertical lines, the points (20, 0), (30, 12), (40, 18), (50, 21), (60, 15), (70, 6), (80, 3) and (90, 0) are plotted on the graph paper and then I draw the frequency polygon by adding them.
Solution: Along x-axis one side of the smallest square = 1 mark & along y-axis two sides of the smallest square 1 student. And putting the points and joining then ABCDEFGH frequency polygon is obtained.
Question 2. I draw the frequency polygon for the following frequency distribution table:
| Classes | 0-5 | 5-10 | 10-15 | 15-20 | 20-25 | 25-30 |
| Frequency | 4 | 10 | 24 | 12 | 20 | 8 |
Solution:
| Class | Mid value | Frequency |
| 0-5 | 2.5 | 4 |
| 5-10 | 7.5 | 10 |
| 10-15 | 12.5 | 24 |
| 15-20 | 17.5 | 12 |
| 20-25 | 22.5 | 20 |
| 25-30 | 27.5 | 8 |
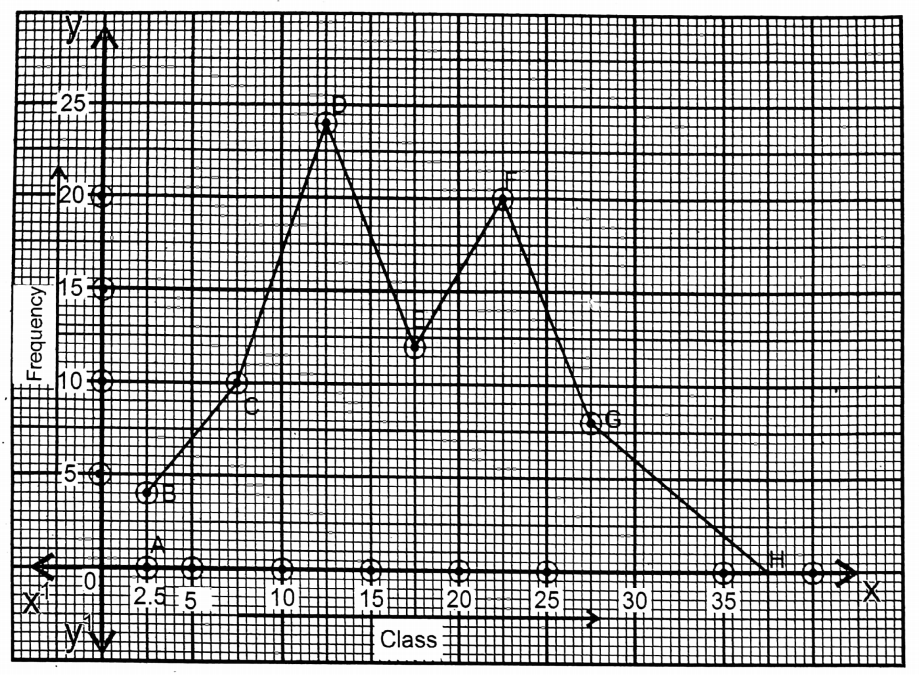
- Class along x-axis & frequency along y-axis.
- Taking the points of mid-value & frequency points are plotted, B(2.5, 4) C(7.5, 10), D(12.5, 24), E(17.5, 12), F(22.5, 20), G(27.5, 8)
- Joining A, B, C, D, E, F, G, H with a scale we get, ABCDEFGH a frequency polygon.
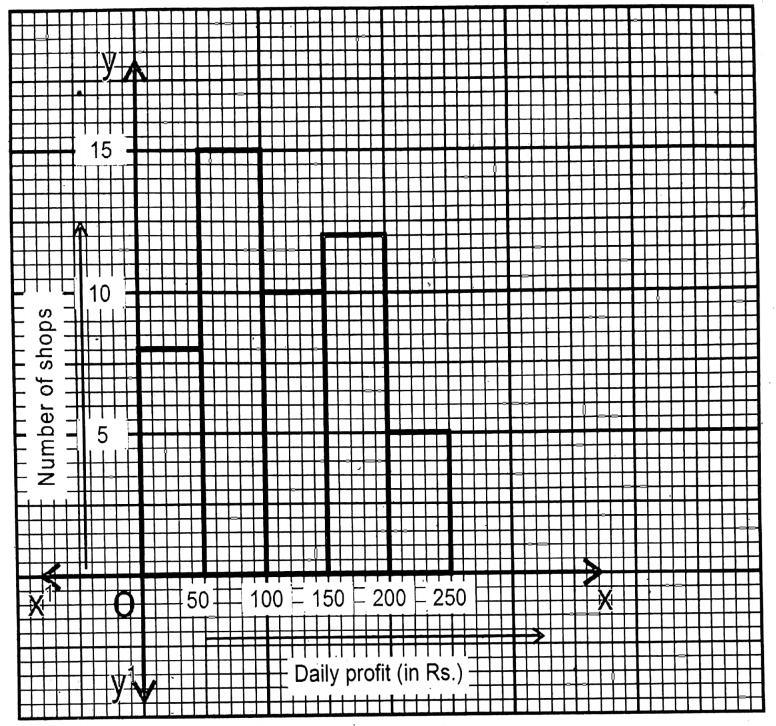
Question 3. I write below in tabular form the daily profit of the 50 shops of the village of Bakultala:
| Daily profit (Rs.) | 0-50 | 50-100 | 100-150 | 150-200 | 200-250 |
| Number of shops | 8 | 15 | 10 | 12 | 5 |
Wbbse Class 9 Maths Statistics Chapter 11
Solution: Along x-axis – Daily profit
Along y-axis No. of shops
One side of the smallest square along x-axis = Rs. 10 (Profit); two sides of the smallest square along y-axis = 1 shop.
I draw the histogram for the above data.
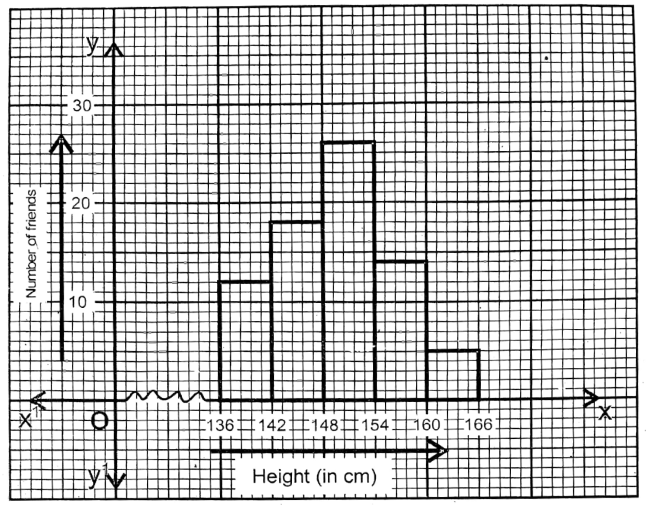
Question 4. By measuring, Mita wrote the heights of her 75 friends of their school in the table given below : I draw the histogram of the data collected by Mita.
| Height (cm.) | 136-142 | 142-148 | 148-154 | 154-160 | 160-166 |
| Number of friends | 12 | 18 | 26 | 14 | 5 |
Solution: Along x-axis – height (in cm) &
along y-axis No. of friends
unit:- 5 sides of the smallest square along x-axis = 6 cm & 1 side of the smallest square along y-axis = 1 friend. Putting the value, I draw the histogram for the given data
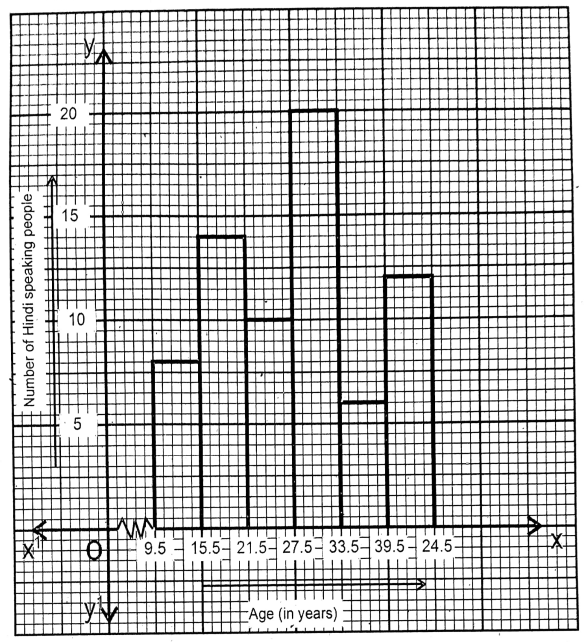
Question 5. In our locality, by collecting the number of Hindi-speaking people between the ages of 10 years to 45 years, I write them in the table given below:
| Age (in years) | 10-15 | 16-21 | 22-27 | 28-33 | 34-39 | 40-45 |
| Number of Hindi-speaking people | 8 | 14 | 10 | 20 | 6 | 12 |
Solution: First make a frequency distribution table
| Class (year) | Class boundary | Length of class | Frequency |
| 10-15 | 9.5 – 15.5 | 6 | 8 |
| 16-21 | 15.5 – 21.5 | 6 | 14 |
| 22-27 | 21.5-27.5 | 6 | 10 |
| 28-33 | 27.5 – 33.5 | 0.6 | 20 |
| 34-39 | 33.5 – 39.5 | 6 | 6 |
| 40-45 | 39.5 – 45.5 | 6 | 12 |
Along the x-axis – Age (year) & Along the y-axis – No. of Hindi-speaking people Unit 5 sides of the smallest square along the x-axis & 2 sides of the smallest square along the y-axis = 1 people
Putting the value, I draw the histogram.
Wbbse 9th Class Maths Statistics Step By Step Solutions
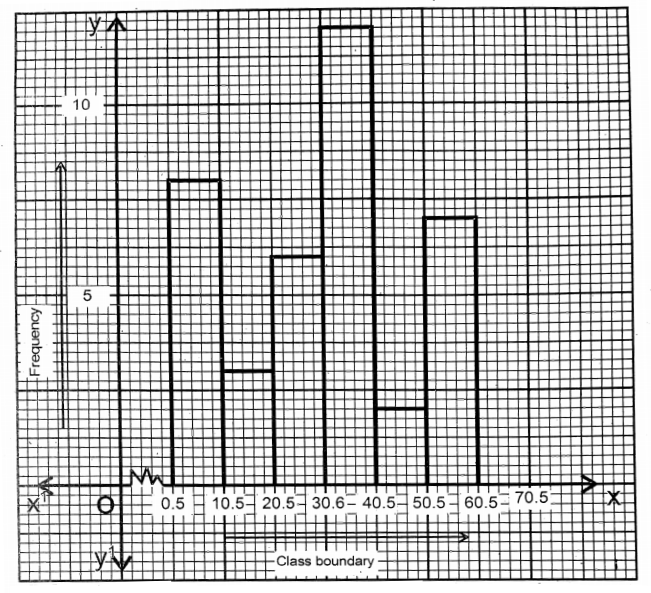
Question 6. I draw the histogram of the frequency distribution table given below:
| Class | 1-10 | 11-20 | 21-30 | 31-40 | 41-50 | 51-60 |
| Frequency | 8 | 3 | 6 | 12 | 2 | 7 |
Solution: Frequency distribution table
| Class | Class-boundary | Length of Class | Frequency |
| 1-10 | 0.5 – 10.5 | 10 | 8 |
| 11-20 | 10.5-20.5 | 10 | 3 |
| 21-30 | 20.5 – 30.5 | 10 | 6 |
| 31-40 | 30.5 – 40.5 | 10 | 12 |
| 41-50 | 40.5 – 50.5 | 10 | 2 |
| 51-60 | 50.5 – 60.5 | 10 | 7 |
Along x-axis-class boundary
& Along y axis – Frequency along x-axis
unit one side of the smallest square = 2 units
& Four side of the smallest square along y-axis = 1 unit
Putting the value, Histogram is obtained
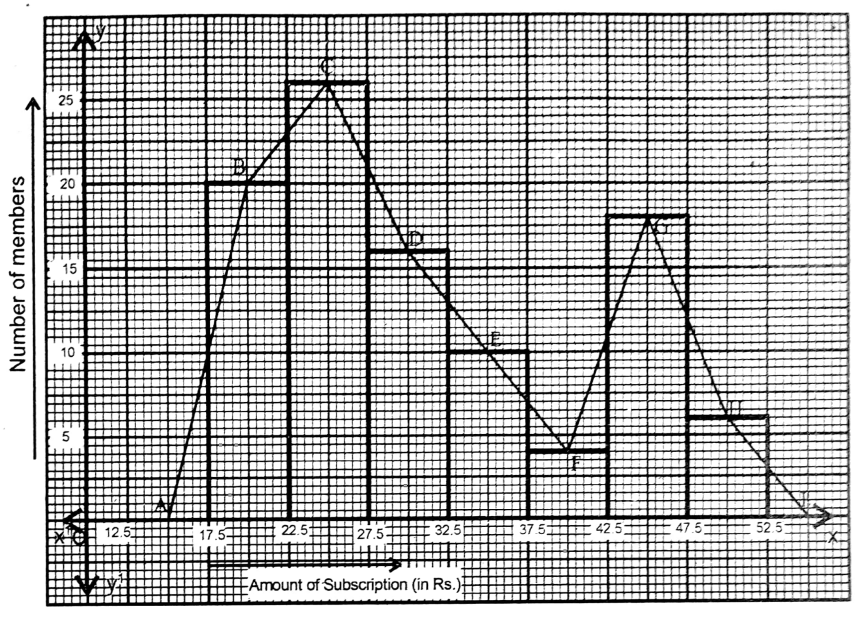
Question 7. By drawing the histogram, I draw the frequency polygon of the frequency distribution table given below:
| Amount of subscriptions (Rs.) | 20 | 25 | 30 | 35 | 40 | 45 | 50 |
| Number of Members | 20 | 26 | 16 | 10 | 418 | 6 |
Solution: Frequency distribution table
| Class (Rs.) | Mid value | Frequency (no. of members) |
| 17.5-22.5 | 20 | 20 |
| 22.5-27.5 | 25 | 26 |
| 27.5-32.5 | 30 | 16 |
| 32.5-37.5 | 35 | 10 |
| 37.5-42.5 | 40 | 4 |
| 42.5-47.5 | 45 | 18 |
| 47.5-52.5 | 50 | 6 |
Along x-axis Amount of Subscription (Rs.)
& Along y-axis Number of members (Frequency)
Unit 2 sides of the smallest square along the x-axis = Re. 1; 2 sides of the smallest square along y-axis = 1 member.
Now I draw the histogram.
Now for the drawing of frequency polygon just before the first class interval I take class interval 12.5 17.5 and just after class interval, I take class interval 52.5 –
57.5. The frequencies of these two class intervals are 0.
(30,16), (35,10), (40,4), (45,18), (50-6) & (55,0) successively with straight lines, I have drawn the frequency polygon ABCDEFGHI.
Class 9 Math Solution WBBSE In English
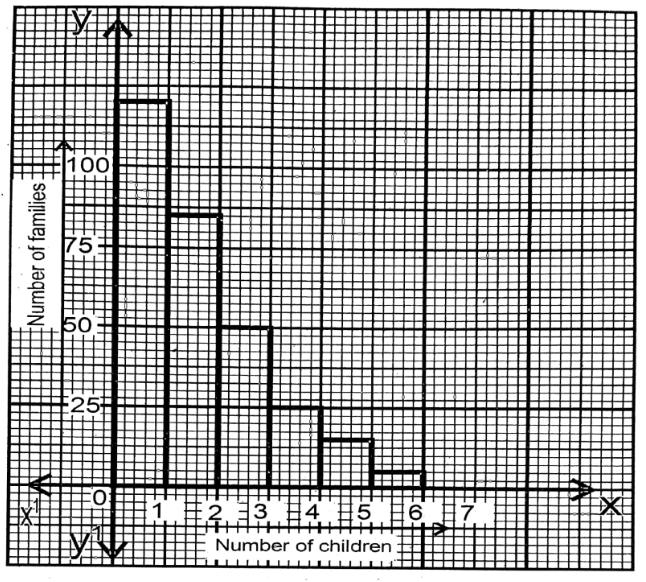
Question 8. I draw the histogram for the following frequency distribution table:
| Number of children | 0 | 1 | 2 | 3 | 4 | 5 |
|
Number of families |
85 | 50 | 25 | 15 | 5 |
Hints: At first, by the exclusive class method the statistical data will be constructed as a frequency distribution table with class boundaries given below:
| Number of children | 0-1 | 1-2 | 2-3 | 3-4 | 4-5 | 5-6 |
| Number of families | 120 | 85 | 50 | 25 | 15 | 5 |
Solution: Frequency distribution table
| Class (No. of children) | Frequency (No. of families) |
| 0-1 | 120 |
| 1-2 | 85 |
| 2-3 | 50 |
| 3-4 | 25 |
| 4-5 | 15 |
| 5-6 | 5 |
Along x-axis – No of children & Along y-axis – Number of families
Unit: 5 sides of the smallest square along x-axis = 1 child. 2 sides of the smallest square along y-axis = 5 families
Putting the values Histogram is obtained.
Wbbse Class 9 Maths Statistics Formulas And Examples
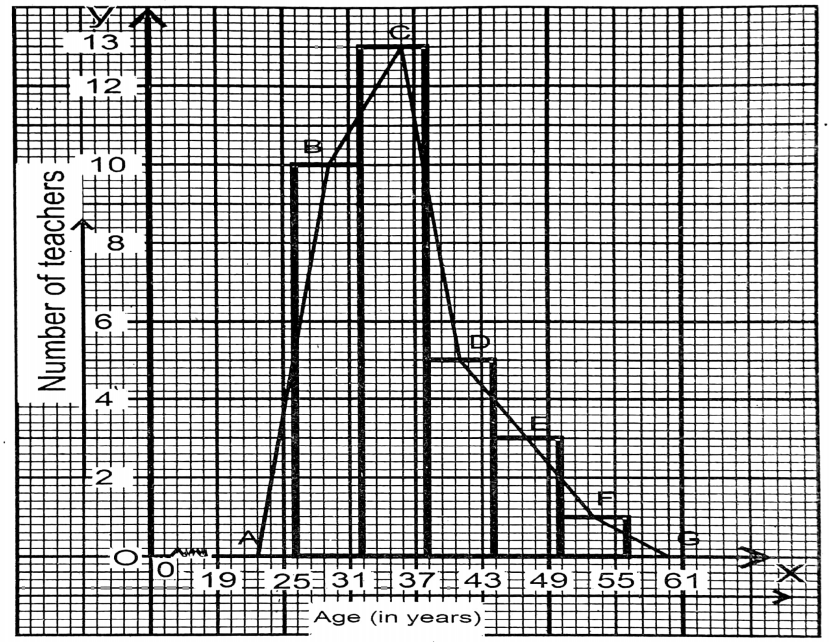
Question 9. I have written the ages of 32 teachers of Primary Schools in the village of Virsingha in a table given below:
| Ages (years) | 25-31 | 31-37 | 37-43 | 43-49 | 49-55 |
| Number of teachers | 10 | 13 | 5 | 3 | 1 |
Now, we have to draw a histogram and frequency polygon with the given data graphically:
Solution: Frequency distribution table
| Class Age (years) | Class boundary | Mid value | Length | Frequency(No. of teachers) |
| 25-31 | 25-31 | 28 | 6 | 10 |
| 31-37 | 31 -37 | 34 | 6 | 13 |
| 37-43 | 37-43 | 40 | 6 | 5 |
| 43-49 | 43-49 | -46 | 6 | 3 |
| 49-55 | 49-55 | 52 | 6 | 1 |
Along x-axis Age (years) & Along y-axis – The number of teachers
Unit: 1 side of the smallest square along x – axis = 1 year and 5 sides of the smallest square along the y-axis = 1 teacher.
Now I draw the histogram.
Class 9 Math Solution WBBSE In English
Now for drawing frequency polygon just before 1st class interval, I take a class interval of 19-25, and just after the last class interval, I take another class interval of 55- 61. The frequencies of these two class intervals are 0 (Zero).
Then by joining the points (22,0), (28,10), (34,13), (40,5), (46,3), (52,1), and (58,0) successively with straight lines, frequency polygon ABCDEFG is obtained.
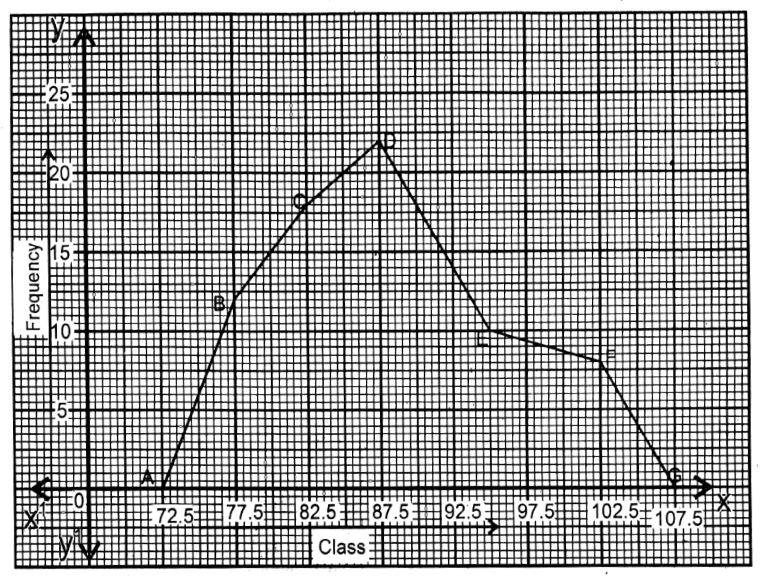
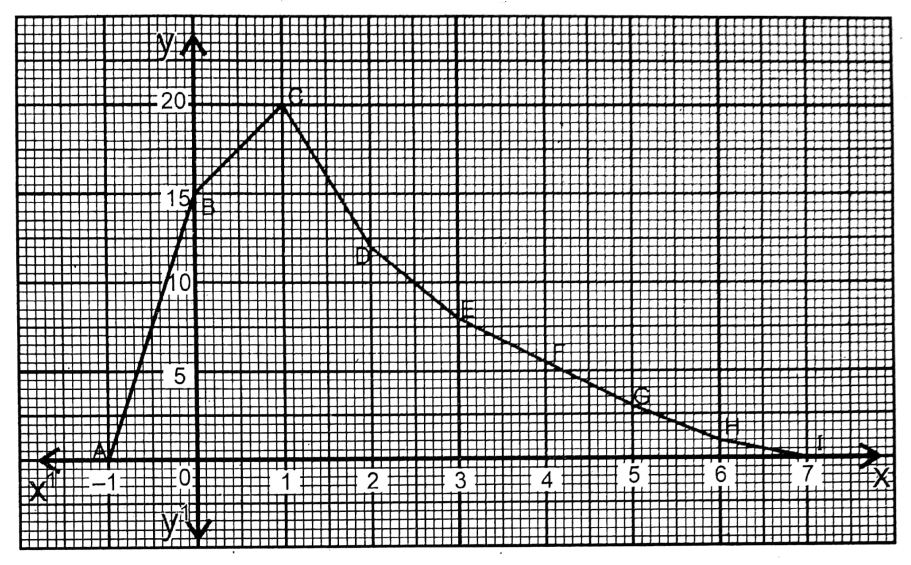
Question 10. I draw the frequency polygon for the following frequency distribution table:
| Class | 75-80 | 80-85 I | 85-90 | 90-100 | 100-105 |
| Frequency | 12 | 18 | 22 | 10 | 8 |
Solution: Frequency distribution table
| Class | Mid value | Frequency |
| 75-80 | 77.5 | 12 |
| 80-85 | 82.5 | 18 |
| 85-90 | 87.5 | 22 |
| 90-100 | 95 | 10 |
| 100-105 | 102.5 | 8 |
Along x-axis Class & along y-axis Frequency
Unit: 2 sides of the smallest square along x-axis = 1 unit and 2 sides of the smallest square along the y-axis= 1 unit.
Now for drawing frequency polygon just before 1st class interval I take a class interval of 70-75 and just after the last class interval, I take another class interval of 105- 110. The frequencies of the two class intervals are 0 (Zero).
Then by doing the points (72.5,0) & (107.5,0) successively with a straight line the freguency polygon ABCDEFG is obtained.
Class 9 Wbbse Statistics Chapter 11 Solved Exercises
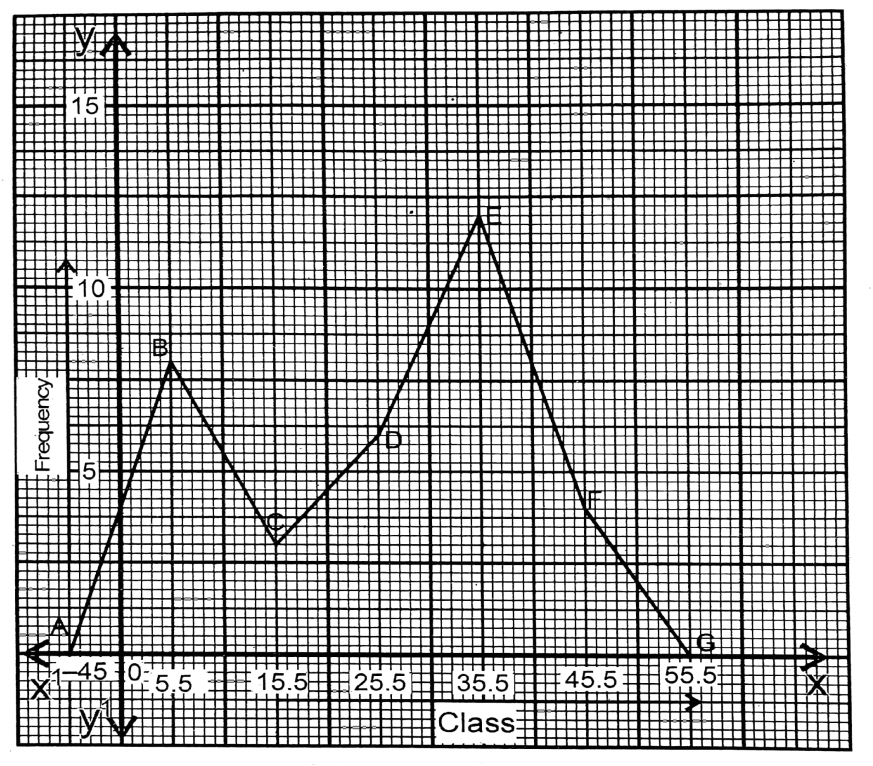
Question 11. I draw the frequency polygon for the following frequency distribution table.
| Class | 1-10 | 11-20 | 21-30 | 31-40 | 41-50 |
| Frequency | 8 | 3 | 6 | 12 | 4 |
Solution: Frequency distribution table
| Class | Class boundary | Mid Value | Frequency |
| 1-10 | 0.5-10.5 | 5.5 | 8 |
| 11-20 | 10.5-20.5 | 15.5 | 3 |
| 21-30 | 20.5-30.5 | 25.5 | 6 |
| 31-40 | 30.5 – 40.5 | 35.5 | 12 |
| 41-50 | 40.5 – 50.5 | 45.5 | 4 |
Along x-axis – Class & along y-axis – Frequency
Unit: 1 side of the smallest square along x-axis = 1 unit and 4 sides of the smallest square along y-axis = 1 unit
Now for drawing frequency polygon just before 1st class interval I take a class interval of -10,-0 and just after the last class interval, I take another class interval 51- 60.
The frequencies of these two class intervals are 0 (Zero). Then by joining the points (-4.5,0), (5.5,8), (15.5,3), (25.5,6), (35.5,12), (45.5,4), and (55.5,0) successively with straight lines we obtained ABCDEFG, frequency polygon.
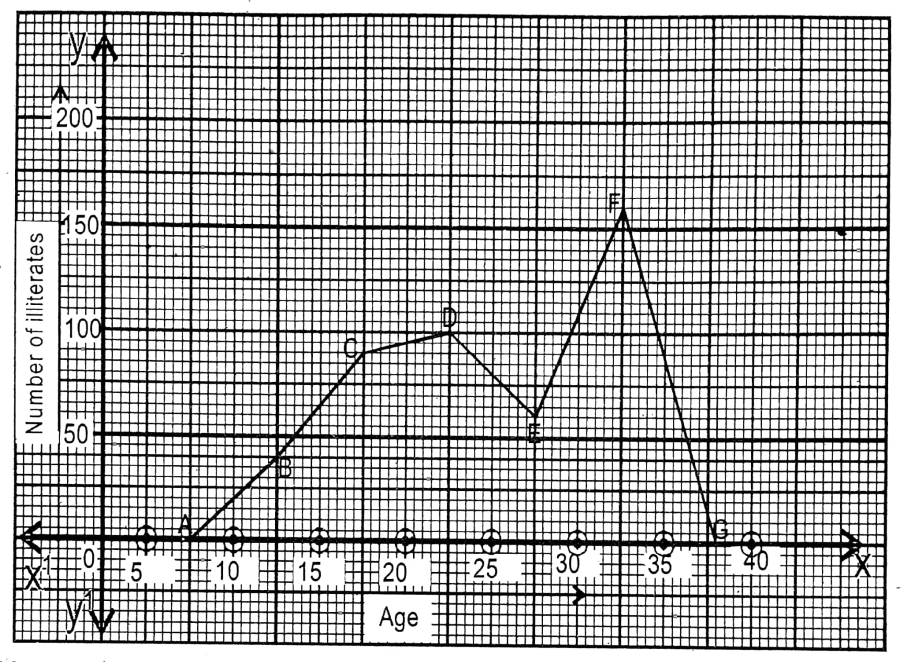
Question 12. A special drive will be taken for women’s literacy in total in our village. For this reason, we have collected the following data:
| Age | 10-15 | 15-20 | 20-25 | 25-30 | 30-35 |
| Number of illiterates | 40 | 90 | too | 60 | 160 |
Solution: To draw the frequency polygon
Frequency distribution table
| Class Age (years) | Mid value | Frequency (No. of illiterates) |
| 10-15 | 12.5 | 40 |
| 15-20 | 17.5 | 90 |
| 20-25 | 22.5 | 100 |
| 25-30 | 27.5 | 60 |
| 30-35 | 32.5 | 160 |
Along x-axis-Class (Age) & along y-axis is the Number of illiterates
Unit: 2 sides of the smallest square along x axis = 1 year & 1 side of the smallest square along the y-axis = 5 number of illiterates.
Now for drawing frequency polygon just before 1st class interval I take a class interval 5-10 and just after the last class interval, I take another ass interval of 35-40.
The frequencies of these two class intervals are 0 (Zero). Then by joining the points (7.5,0), (12.5,40), (17.5,90), (22.5,100), (27.5,60), (32.5,160), and (37.5,0) straight lines we get the required frequency polygon ABCDEFG.
Question 13. I have written in the following the frequency of the number of goals given by the teams in our Kolkata football league in the previous month. I draw the frequency polygon for the representation of the data.
| Scores | 0 | 1 | 2 | 3 | 4 | 5 | 6 |
| Frequency | 15 | 20 | 12 | 8 | 6 | 3 | 1 |
Solution: Frequency distribution table
| Score | Frequency |
| 0 | 15 |
| 1 | 20 |
| 2 | 12 |
| 3 | 8 |
| 4 | 6 |
| 5 | 3 |
| 6 | 1 |
Along x-axis-score (goal) & along y-axis – Frequency
Unit 10 sides of the smallest square along x-axis = 1 unit and 2 sides of the smallest square along y-axis = 1 unit.
Now for drawing frequency polygon just before 1st class interval I take a class interval of -1,-0 and just after the last class interval, I take another class interval of 7-0.
The frequencies of these two class intervals are 0 (Zero). Then by joining the points (1,0), (0,15), (1,20), (2,12), (3,0), (4,6) and (5,3), (6,1) & (7,0) successively with straight lines we obtained frequency polygon ABCDEFGHI,
Question 14. Let us discuss
1. Each of the area of each of the rectangle of a histogram is proportional to
1. The mid-point of that class
2. The class size of that class
3. The frequency of that class
4. The cumulative frequency of that class
Solution: 3. The frequency of that class
2. A frequency polygon is drawn
1. Upper limit of the class
2. Lower limit of the class
3. Mid-value of the class
4. Any value of the class
Solution 3. Mid-value of the class
3. To draw a histogram, the class
1. Along y-axis
2. Along x-axis
3. Along x-axis and y-axis both
4. In between x-axis and y-axis
Solution: 2. Along x-axis
4. In the case of drawing a histogram,
1. Frequency
2. Class boundary
3. Range.
4. Class size.
Solution: 4. Class size.
5. A histogram is the graphical representation of grouped data whose class- boundary and frequency are taken respectively,
1. Along the vertical axis and horizontal axis,
2. Only along the vertical axis,
3. Only along horizontal axis,
4. Along the horizontal axis and vertical axis.
Solution: 4. Along the horizontal axis and vertical axis.