
Class 6 Math Solutions WBBSE Chapter 13 Data Handling And Analysis Exercise 13
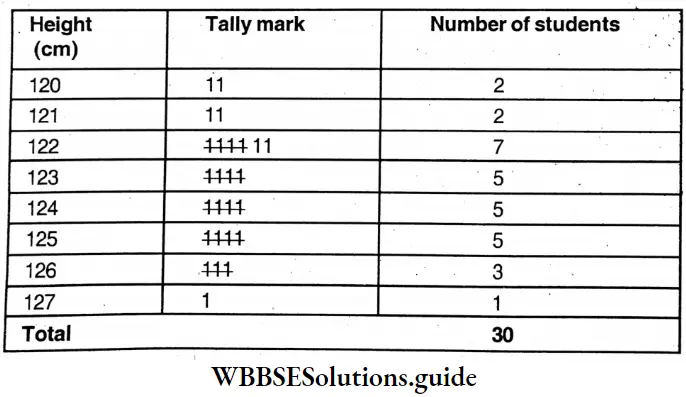
Example: Like every year, this year the Physical Education teacher of our school took measurements (in cm) of the height of the students of class 6 who would be taking part in school sports. The data obtained is given below
Given: The height of the students of class 6
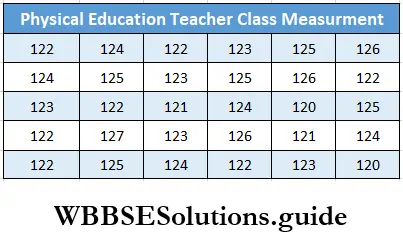
⇒ The shortest height = 120 and the tallest height = 127.
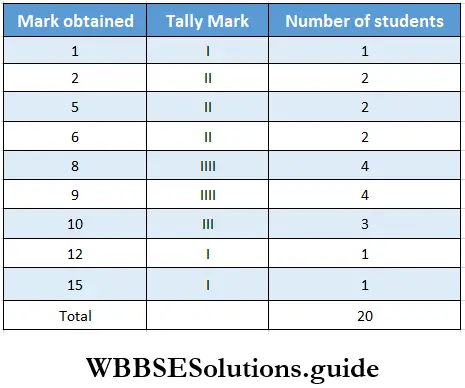
Question 1. In a class test of 15 marks, I prepare a list showing marks obtained by 20 students. Let’s write down these marks by giving tally marks and prepare a frequency distribution chart. 9, 8, 6, 10, 2, 1,15, 12, 8, 6, 9, 2, 8, 5, 9, 10, 5, 9, 10, 8
Solution:
Given
In a class test of 15 marks, I prepare a list showing marks obtained by 20 students.
9, 8, 6, 10, 2, 1,15, 12, 8, 6, 9, 2, 8, 5, 9, 10, 5, 9, 10, 8
⇒ Frequency Distribution Table
Read and Learn More WBBSE Solutions For Class 6 Maths
“WBBSE Class 6 Maths Chapter 13 data handling solutions”
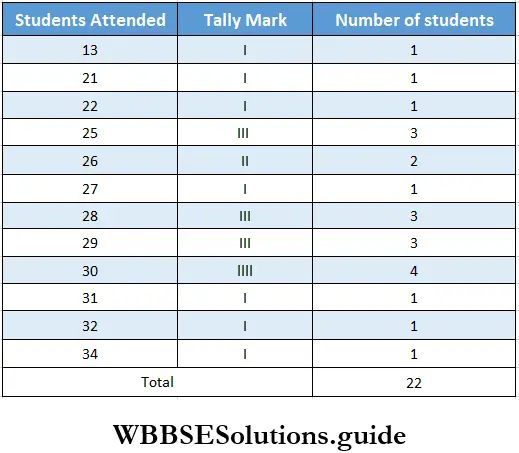
Question 2. In Jahanara’s school classes were held for 22 days only this month. The number of students attending classes on these 22 days is given below. 30, 28, 34,29,25,30,28,26,29,30, 22,25,26,29, 30, 31,21,27, 25,13, 32, 28. Using the above raw data, let’s prepare a frequency distribution chart with tally marks.
Class 6 Math Solutions WBBSE
Solution:
Given
In Jahanara’s school classes were held for 22 days only this month. The number of students attending classes on these 22 days are given below. 30, 28, 34,29,25,30,28,26,29,30, 22,25,26,29, 30, 31,21,27, 25,13, 32, 28.
⇒ Frequency distribution table
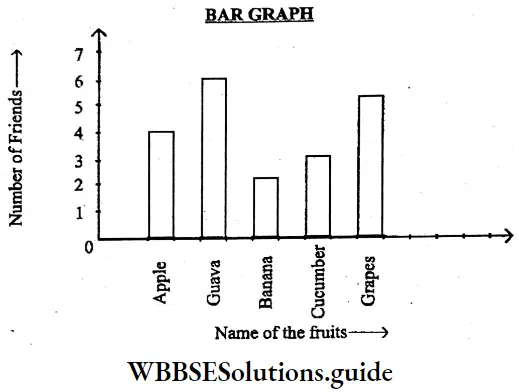
Question 3. Given below is the data showing what fruits my 20 friends like to have. Let me draw a bar graph based on this data.
Solution:
| Class 6 History | Class 6 Social Science |
| Class 6 Geography | Class 6 Science |
| Class 6 Maths | Class 6 Science MCQs |
| Class 6 General Science | Class 6 Maths Solutions |
| Class 6 Geography | Class 6 Hindi |
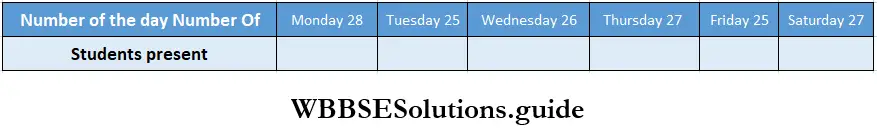
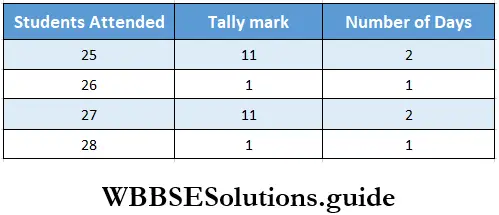
Question 4. I prepared raw data showing the number of students present in the class for 6 days of this week. From this raw data, I prepare a list using tally marks. Let’s write down from the list the day of the week on which the least number of students are present.
Solution:
⇒ I prepare a raw data showing number of students present in the class for 6 days of the week.
Class 6 Math Solutions WBBSE
⇒ Frequency distribution table
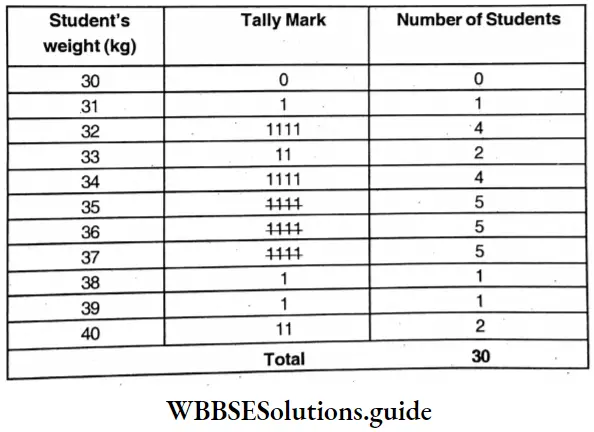
Question 5. I write down the weight (kg) of 30 students of class VI of Soham’s school. 32, 32, 37, 34, 37, 35, 35, 36,37, 39, 40, 36, 37, 36, 33,31,32,36, 37,38, 40, 34, 36, 34, 35, 33, 34, 35, 32, 35 Using the above raw data, let’s prepare a frequency distribution chart.
Solution:
⇒ Weight (kg) of 30 students of class 32, 32, 37, 34, 37, 35, 35, 36, 37, 39, 40, 36, 37, 36, 33, 31,32, 36, 37, 38, 40, 34, 36, 34, 35, 33, 34, 35, 32, 35
| Class 6 History | Class 6 Social Science |
| Class 6 Geography | Class 6 Science |
| Class 6 Maths | Class 6 Science MCQs |
| Class 6 General Science | Class 6 Maths Solutions |
| Class 6 Geography | Class 6 Hindi |
⇒ Frequency Distribution Table
Class 6 Math Solutions WBBSE
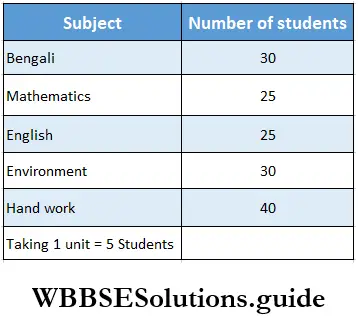
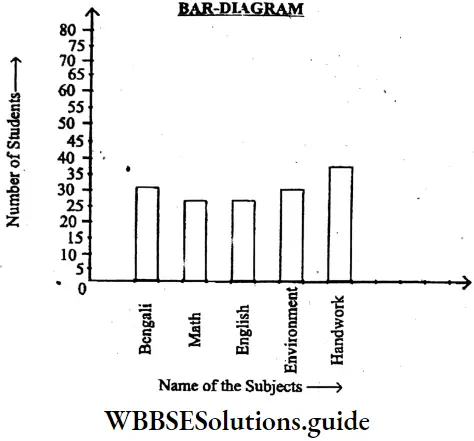
Question 6. From a survey conducted on 150 students of our school, it is seen how many students like to study a special subject. The raw data from the survey is given below
Solution:
“WBBSE solutions for Class 6 Maths data handling and analysis”
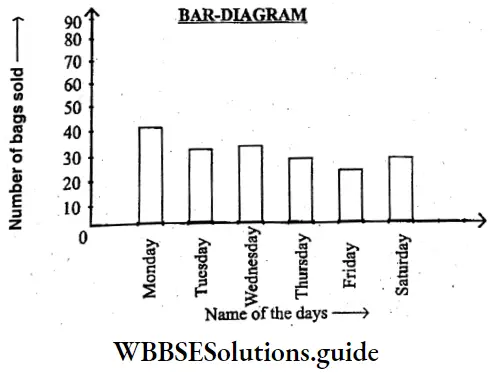
Question 7. Ram da has a shop selling bags in Haidar Para. Ram da himself makes the bags. I prepare a list of bags sold from the shop this week.
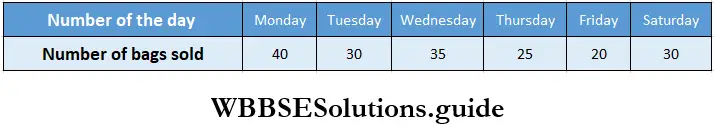
Let take a scale of my choice and draw a bar diagram.
Solution:
“Class 6 Maths WBBSE Chapter 13 data handling exercises”
Question 8. I have prepared a bar diagram showing the number of students appearing at the Madhymik Examination each year during the five years.
- I have prepared a set of questions from the bar diagram and let’s answer the questions.
- Let us see in which year a maximum number of students have sat for the exam.
- Let us see in which year the least number of students have sat for the exam.
- Let’s see how many more students appeared for the examination in 2011 than in 2010.
- In 2010, let us see how many less students have appeared for the exam than in 2009.
- Let’s see how many total students have sat for examination between 2008 and 2010.

“Step-by-step solutions for data handling Class 6 WBBSE”
Solution:
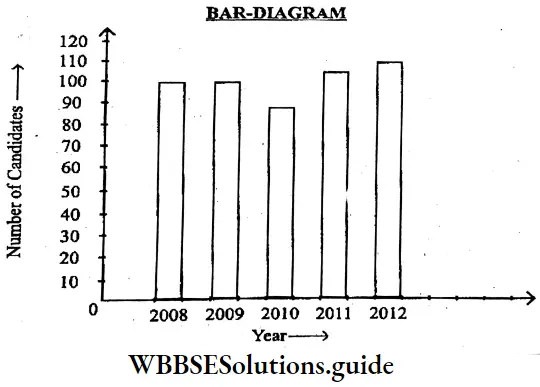
- 2012
- 2010
- 120-100 = 20
- 100-90 = 10
- 110 + 100 + 90