
Algebra Chapter 8 Double Bar Graph Exercise 8 Solved Problems
⇒ A bar graph is a graphical representation of the numerical data by several rectangular bars of uniform width erected horizontally or vertically with equal spacing between them.
⇒ Each rectangle or bar represents only one value of the numerical data. The height or length of a bar indicates on a suitable scale the corresponding value of the numerical data.
This method of representing or explaining the statistical data is called the Bar diagram or Bar graph.
⇒ To draw a bar graph we draw two mutually perpendicular lines in the plane paper. The horizontal line is called the X-axis and the vertical line is known as the Y-axis.
⇒ If the bars are drawn vertically on a horizontal line, then the scale of heights of the bars is shown along the Y-axis. If the bars are drawn horizontally on the vertical line, then the scale of the height of the bars is shown along the X-axis. The bars can be shaded, hatched, or colored.
Read and Learn More WBBSE Solutions for Class 7 Maths
⇒ Double Bar Graph: When two bar graphs are drawn side by side along the same reference lines for better comparison of data as has been done in the graph, this is called a Double Bar Graph.
“WBBSE Class 7 Maths Algebra Chapter 8 Double Bar Graph solutions step-by-step”
Question 1. We prepared a single bar graph of the number of members from each 55 families in our locality
Scale: 1 unit = 1 family.

From the bar graph answers the following questions:
1. Out of 55 families, how many families have 4 members?
2. Out of 55 families, how many have a maximum number of family members?
3. From the bar graph find ![]() families have 5 members and members and
families have 5 members and members and ![]() families have 3 members.
families have 3 members.
Solution:
1. Out of 55 families, 15 families have 4 members.
2. Out of 55 families, the maximum number of family members is 5.
3. From the graph we find 5 families have 5 members and 20 families have 3 members.
Question 2. Read the following double-bar graph and answer the following questions.
Scale: 1 unit = 1 ton.
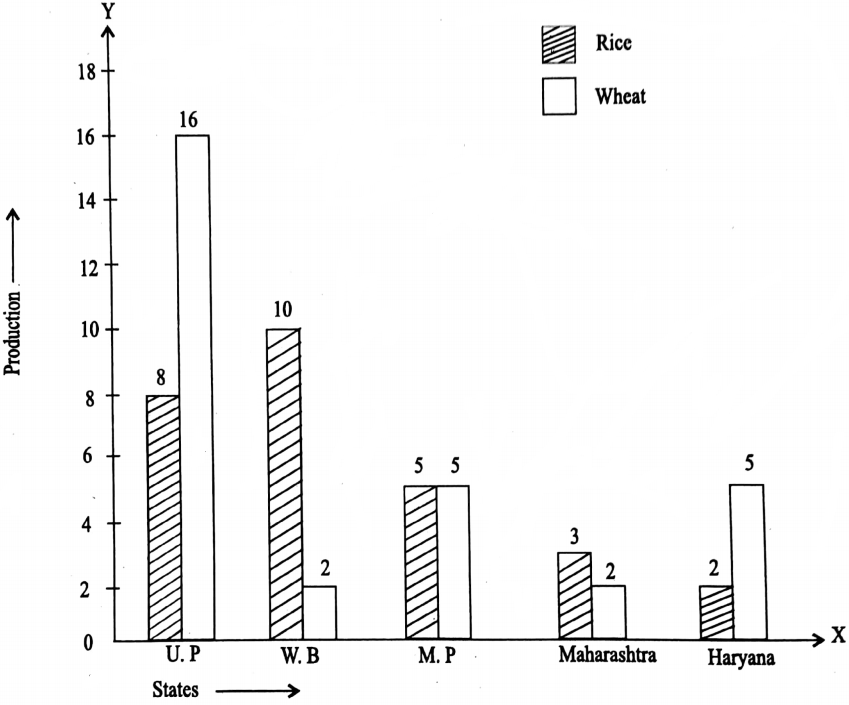
1. What information is given by the bar graph?
2. Which state is the largest producer of rice?
3. Which state is the largest producer of wheat?
4. Which state has the total production of rice and wheat as its maximum?
5. Which state has the total production of rice and wheat minimum?
Solution:
1. It gives information regarding rice and wheat production in various states.
2. W. B.
3. U. P.
4. U. P.
5. Maharashtra.
“West Bengal Board Class 7 Maths Chapter 8 Double Bar Graph solved problems”
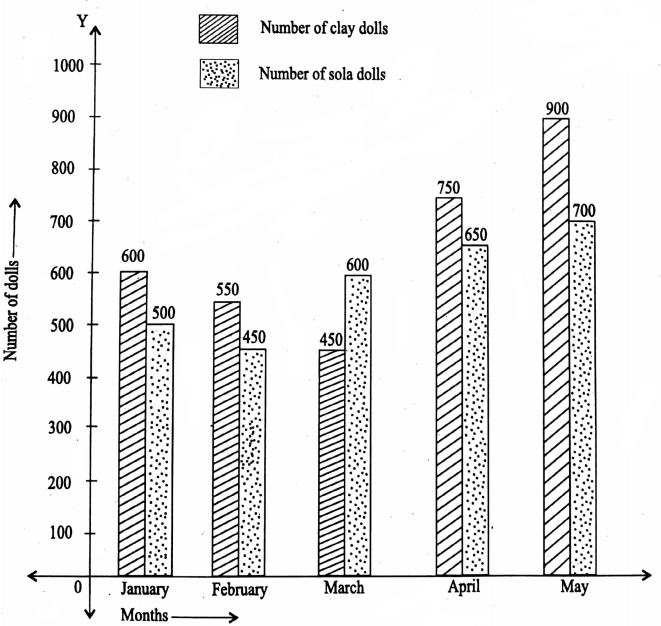
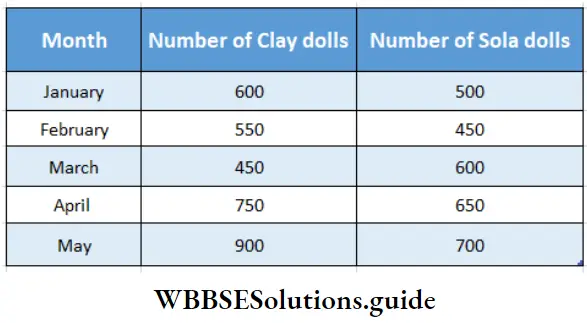
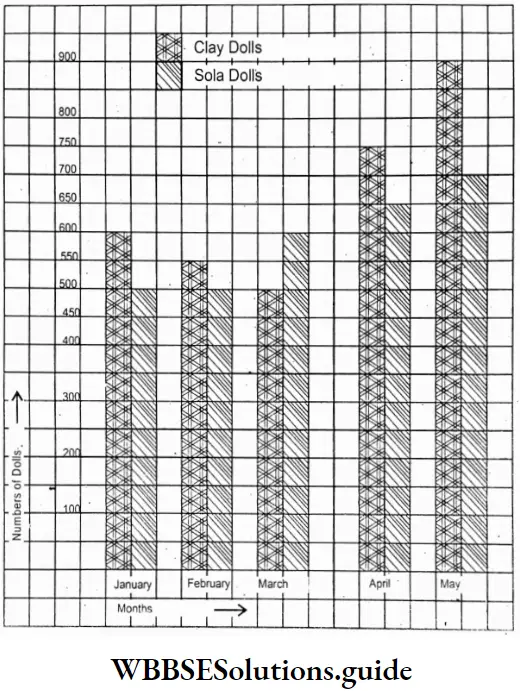
Question 3. Given below is the date of the number of clay dolls and sola dolls a potter in Krishnanagar has made in 5 months. Express the data through the double-bar graph.
| Month | January | February | March | April | May |
| Number of clay dolls | 600 | 550 | 450 | 750 | 900 |
| Number of Sola dolls | 500 | 450 | 600 | 650 | 700 |
Solution:
Scale: 1 Unit = 100 dolls
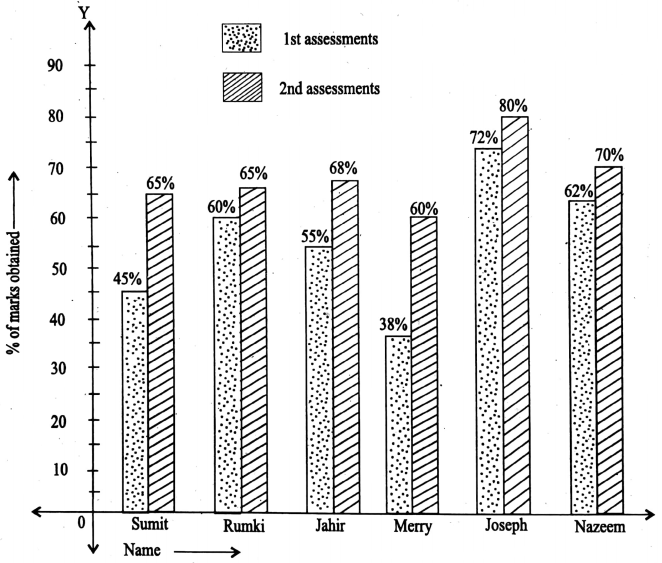
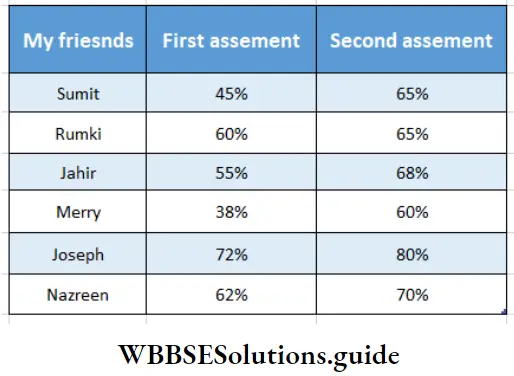
Question 4. After first continuous assessment, 6 friends worked in a group to grasp the subjects learnt through practical applications and through different methods. A table of the percentage of marks obtained in two continuous assessments after the second assessment.
| Friends | Sumit | Rumki | Jahir | Merry | Joseph | Nazeen |
| 1st assessments | 45% | 60% | 55% | 38% | 72% | 62% |
| 2nd assessments | 65% | 65% | 68% | 60% | 80% | 70% |
preparing the double bar graph
Solution:
Scale: 1 Unit = 1%
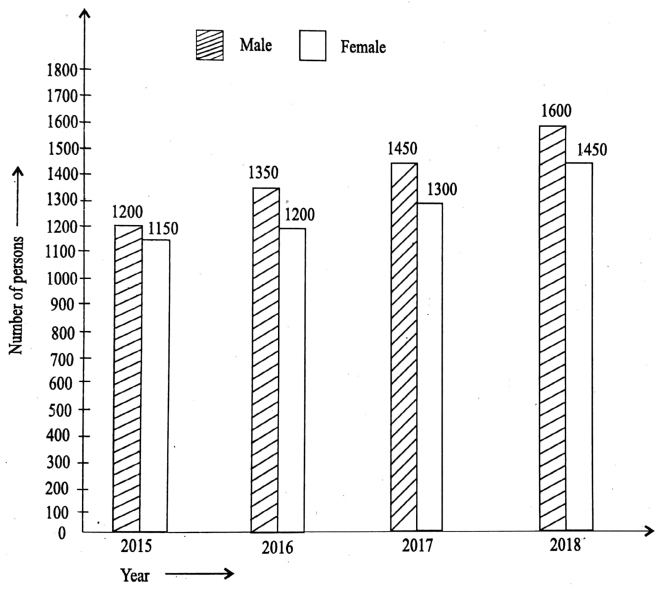
Question 5. The number of Male and Female people of a village in the year 2015-2018 are given the following table
| Year | 2015 | 2016 | 2017 | 2018 |
| Male | 1200 | 1350 | 1450 | 1600 |
| Female | 1150 | 1200 | 1300 | 1450 |
Express the above information by a bar graph
Solution:
The number of Male and Female people of a village in the year 2015-2018 are given the table
Scale: 1 unit = 100 persons
Double Bar Graph
Double Bar Graph Exercise 8.1
Question 1. We prepared a single bar graph of the number of members from each of the 55 families in our locality. Let us study the bar graph and try to find the answers to the following question Scale: 1 unit = 1 family
1. Out of 55 families, how many families have 4 members?
Solution: 15
2. Out of 55 families how many have the maximum number of family members
Solution: 3
Question 2. From the bar graph, we find families have 5 members and families have 3 members.
Solution: 5, 2
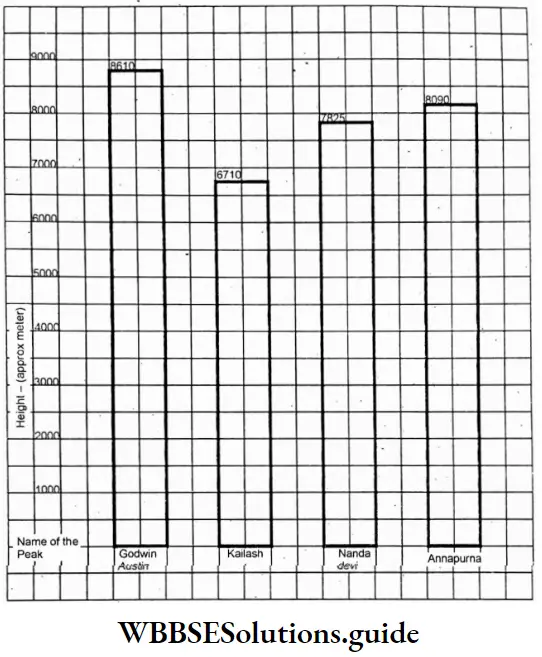
Question 2. A list of mountain peaks and their corresponding heights are given in the chart. Let us prepare a bar graph on squared paper taking 1 unit = 1000 metres.
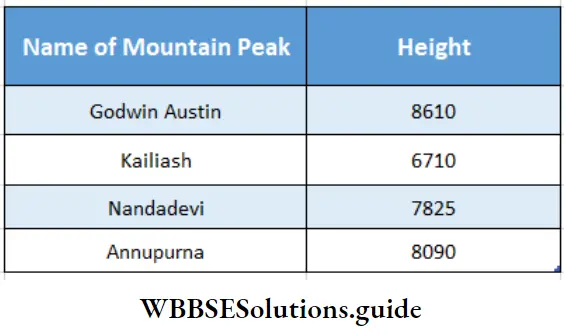
Solution:
Single Bar graph of the Height of different Mountain peaks.
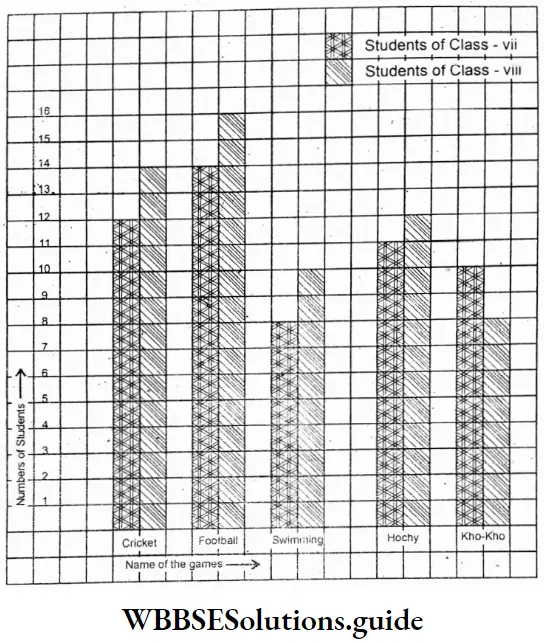
Question 3. For 55 students of class VII and 60 students of class 8 a list of their choice of games has been made. Let us express the data through a double-bar graph.
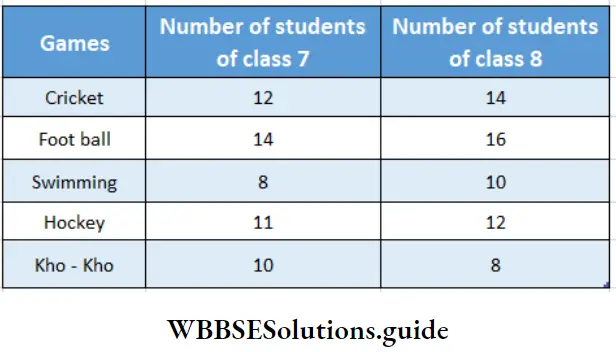
Solution:
Double bar graph of the students of Class 7 & Class 8 on their choice of games.
Question 4. Given below the date of the number of clay dolls and sola dolls a potter in Krishnakumar has made in 5 months. Let us express the data through a double-bar graph
Solution:
Bar Graph of Clay Dolls-& Sola Dolls of Krishnakumar made is 1st 5 months in a year.
“West Bengal Board Class 7 Maths Algebra Chapter 8 Double Bar Graph questions and answers”
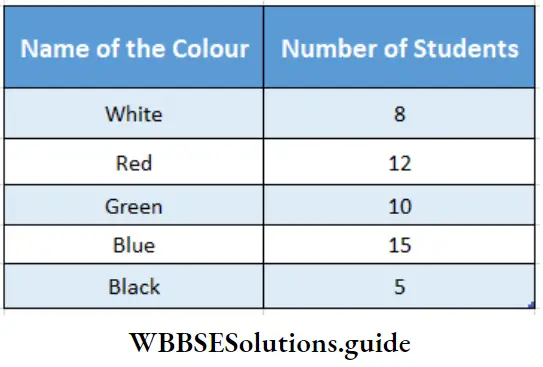
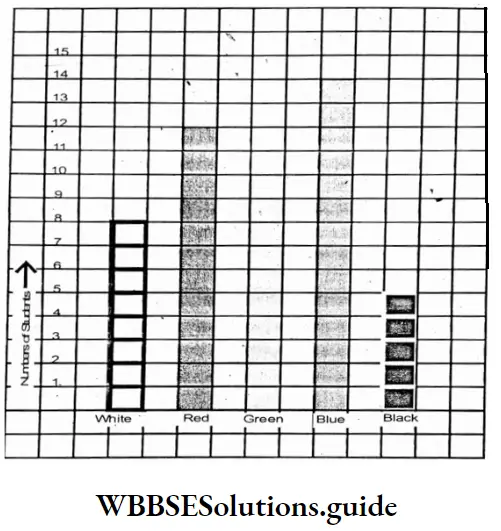
Question 5. I made a list 50 students from my class according to the choices of colours as white, red, green, blue and black and then to express these daias through bar graph. [Let me do it myself.
Solution:
Given
⇒ I made a list 50 students from my class according to the choices of colours as white, red, green, blue
⇒ Bar graph of so students on their choice of colours
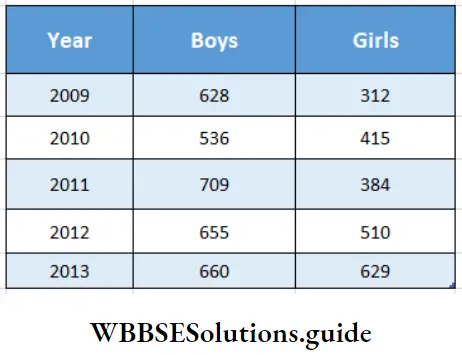
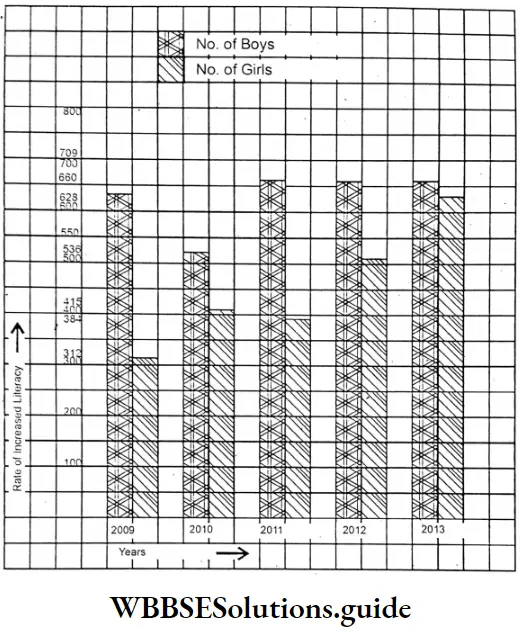
Question 6. The number of boys and girls of Tarai Tarapada Higher secondary school, in the last 4 years and also this year has been listed below. Let us express these data as a double bar graph. We all know the literacy rate has increased with time but let us find it whether the literacy rate of girls are more than boys or they are still backward
Solutions:
Given
⇒ The number of boys and girls of Tarai Tarapada Higher secondary school, in the last 4 years and also this year has been listed
⇒ Double bar graph: For increase in literacy for boys & girls for the year 2009 to 201 3 (5 years)
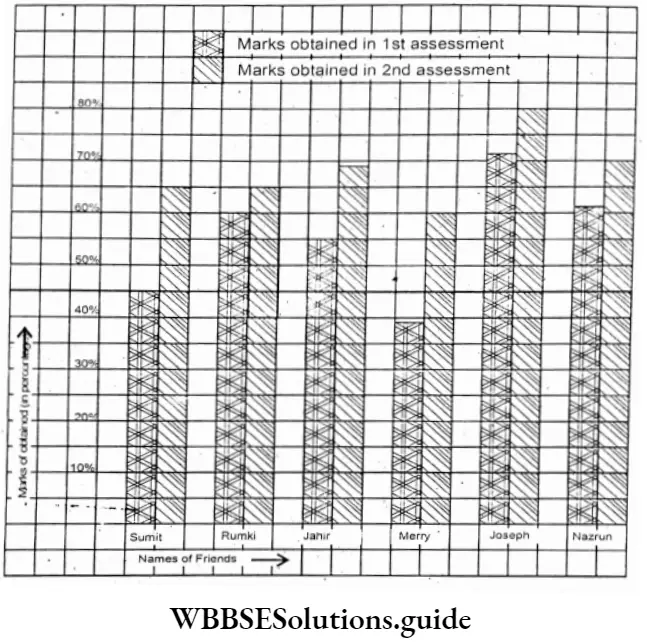
Question 7. After our first continuous assessment, we 6 friends worked in a group to grasp the subjects learnt through practical applications and through different methods. We prepared a table of the percentage of marks obtained in two continuous assessments after the second assessment. Preparing the double bar graph, let us understand, how much the new method helped to improve and who improved most.
Solution:
Double Bar Graph of Mark obtained (in percentage) in 1st & 2nd assessment by my 6 friends.
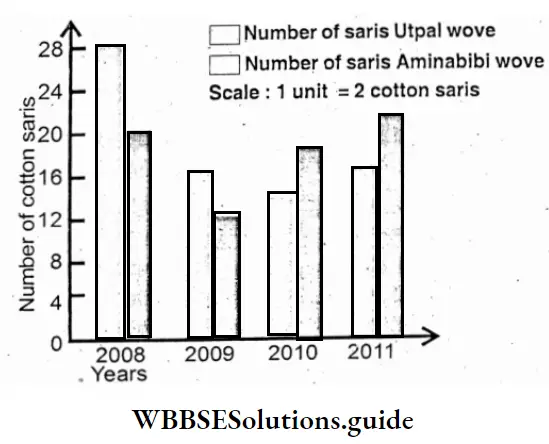
Question 8. The yearly production of cotton saris is woven by Utpal and Aminabibi from Phulia is shown is the double bar graph. Let us try to answer the following questions from the graph
Given
The yearly production of cotton saris is woven by Utpal and Aminabibi from Phulia is shown is the double bar graph.
“WBBSE Class 7 Maths Algebra Chapter 8 Double Bar Graph exercise 8 solutions”
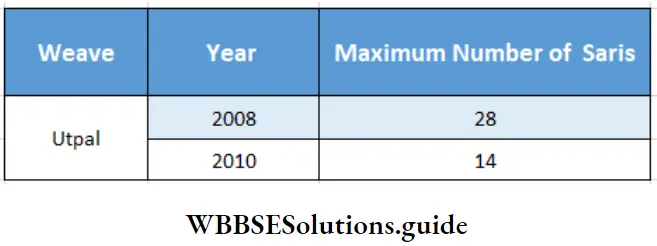
1. In which year did Utpal weave a maximum number of saris, and what is the number of saris woven? Again, in which year did he wove a minimum number of saris and how many are those, let’s find.
Solution:
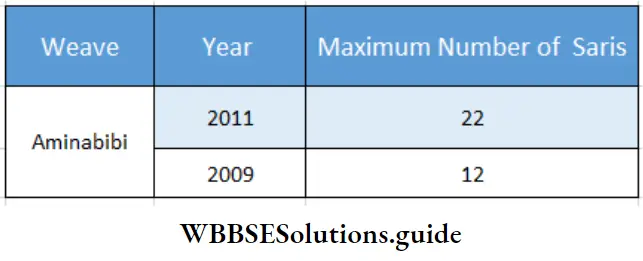
2. In which year did Aminabibi weave a maximum number of saris and how many are those? Also in which year did she wove a minimum number of saris and what is that number, let’s find out.
Solution:
3. In which years did Utpal weave more saris than Aminabibi and in which year he wove a maximum number of saris than Aminabibi, let’s find.
Solution:
Utpal- 2008 & 2009 – 2008
“How to solve WBBSE Class 7 Maths Algebra Chapter 8 Double Bar Graph questions”
4. In which years did Aminabibi weave more saris than Utpal and in which year she wove a maximum number of saris than Utpal, let’s find.
Solution:
Aminabibi – 2010 & 201 0 – 2011